ACA Premium Calculator 2026: Estimate Your Costs After the Cliff
The enhanced premium tax credits that kept ACA premiums affordable since 2021 expired on January 1, 2026. If your household income exceeds 400% of the federal poverty level by even one dollar, you now lose all premium tax credits — a penalty that can cost $10,000 or more per year. An ACA premium calculator built for 2026 needs to account for this cliff, not just estimate a sliding scale.
SubsidyGuard's free calculator shows you exactly where the cliff hits for your household and how different income scenarios change your premium costs.
How ACA Premium Tax Credits Work in 2026
Premium tax credits in 2026 operate under the original ACA formula — not the expanded version from 2021–2025. Eligible households earning between 100% and 400% of the federal poverty level (FPL) pay a capped percentage of income toward a benchmark Silver plan. That percentage starts at 2.10% of income for households at 100% FPL and rises to 9.96% at 300–400% FPL. The government covers the difference between your capped contribution and the actual benchmark premium.
This means a 60-year-old earning $62,000 pays roughly $515/month for a benchmark Silver plan — about 10% of income. The same person earning $64,000, just above the 400% FPL threshold, pays $1,244/month with zero subsidy assistance, according to KFF analysis. That $2,000 income difference creates an $8,748 annual premium increase.
What Is the 400% FPL Income Limit for 2026?
The subsidy cliff sits at 400% of the federal poverty level. For 2026 ACA coverage, the relevant FPL guidelines set these hard cutoffs:
| Household Size | 400% FPL (Subsidy Cliff) |
|---|---|
| 1 person | $62,600 |
| 2 people | $84,600 |
| 3 people | $106,600 |
| 4 people | $128,600 |
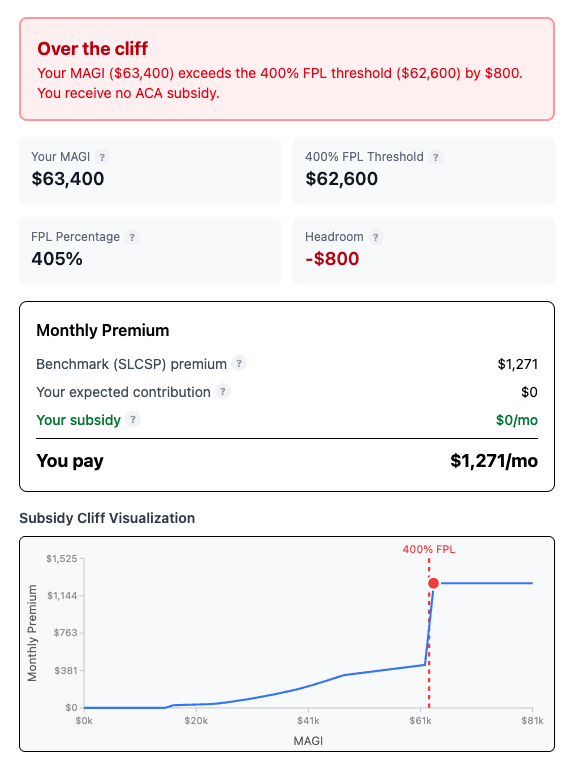
These thresholds use the 2025 HHS poverty guidelines, which apply to 2026 coverage year determinations. Earn $62,601 as a single filer and you owe full unsubsidized premiums — potentially $15,000+ per year for older enrollees.
When I first modeled my own household's numbers in SubsidyGuard, the cliff hit harder than I expected. Setting income to $62,599 showed a $520/month premium with full subsidy support. Moving it to $62,601 — just two dollars more — jumped the premium to over $1,500/month. Seeing that $980/month swing on a single screen made the cliff viscerally real in a way that reading about it never did.
Why Generic Calculators Miss the Cliff
Most ACA premium calculators — including popular tools from KFF, healthinsurance.org, and Healthcare.gov — focus on estimating your subsidy amount at a given income. They answer "what will I pay?" but not "what happens if my income shifts by $1,000?"
That second question matters far more in 2026. The cliff makes ACA planning a boundary problem: you need to know your safe income range, not just your current estimate. A Roth conversion, an unexpected capital gains distribution, or even a small freelance payment can push you over 400% FPL mid-year with devastating financial consequences.
SubsidyGuard was built specifically for this problem. The free calculator shows your subsidy amount and distance from the cliff simultaneously, so you can model "what if" scenarios before making financial decisions.
Who Gets Hit Hardest by the 2026 Cliff
The subsidy cliff doesn't affect everyone equally. Three groups face the steepest penalties.
Early retirees (ages 55–64) pay the highest unsubsidized premiums because ACA plans use age-based rating. A 64-year-old's benchmark premium can exceed $1,500/month before subsidies. Losing the credit at 400% FPL means their annual insurance cost jumps from ~$6,000 to ~$18,000. Nearly 725,000 ACA enrollees earned between 400% and 500% FPL in 2025, according to the Bipartisan Policy Center — many of them in this age bracket.
FIRE community members managing portfolio withdrawals walk a tightrope. A single mutual fund capital gains distribution can spike MAGI above the cliff. ACA uses Modified Adjusted Gross Income, which includes capital gains, taxable IRA withdrawals, and most investment income.
Self-employed individuals with variable income face uncertainty every tax year. A strong Q4 could push annual income past 400% FPL, triggering full premium repayment when filing taxes.
ACA Premium Calculator: What Inputs You Need for 2026
Running your own estimate takes four inputs:
- Household MAGI — Your modified adjusted gross income, including wages, capital gains, Roth conversion amounts, rental income, and Social Security benefits (the taxable portion). This is not the same as your W-2 income.
- Household size — Everyone on your tax return, whether or not they need coverage.
- ZIP code — Benchmark Silver plan premiums vary dramatically by county. A 60-year-old in rural Nebraska pays a very different benchmark than one in Manhattan.
- Ages of covered members — ACA premiums are age-rated, with older adults paying up to 3x more than younger enrollees for the same plan.
With these four inputs, you can calculate your expected contribution percentage, compare it to local benchmark premiums, and determine your premium tax credit — or discover you're over the cliff and owe full price.
The SubsidyGuard calculator runs this calculation instantly and highlights your proximity to the cliff threshold.
Income Strategies to Stay Below the Cliff
Managing your MAGI is the primary tool for staying subsidy-eligible. Several approaches work within the tax code:
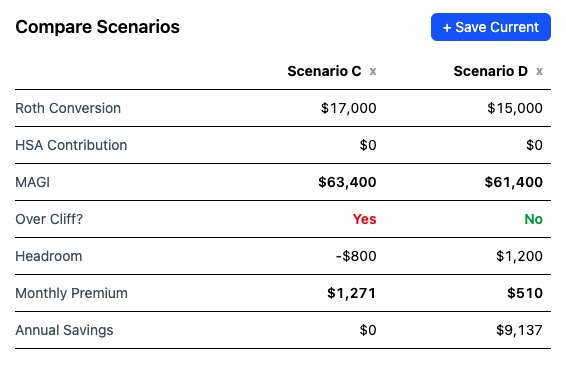
Roth conversions with precision. Convert traditional IRA funds to Roth, but only up to the cliff boundary. A single person with $50,000 in base income has roughly $12,600 of conversion room before hitting $62,600. Each dollar of conversion adds to MAGI. SubsidyGuard's scenario comparison tool lets you model exact conversion amounts against the cliff.
Harvest capital losses. Realized capital losses offset capital gains dollar-for-dollar, reducing MAGI. Timing asset sales to pair gains with losses keeps income below 400% FPL.
Maximize above-the-line deductions. HSA contributions (if eligible from a prior year's HDHP), self-employed health insurance deductions, and traditional IRA contributions all reduce MAGI.
Control the timing of asset sales. Spreading large asset sales across tax years prevents a single-year MAGI spike. This is especially relevant for early retirees drawing down taxable brokerage accounts.
The Math: What One Dollar Over the Cliff Actually Costs
The Congressional Research Service published detailed analysis of the cliff's impact. Here's what it looks like for a single 60-year-old in a median-cost county:
| Annual Income | Monthly Premium | Annual Cost | Subsidy Value |
|---|---|---|---|
| $62,000 | ~$515 | ~$6,180 | ~$11,820 |
| $62,600 | ~$520 | ~$6,240 | ~$11,760 |
| $62,601 | ~$1,500 | ~$18,000 | $0 |
That last row: $1 of additional income triggers $11,760 in lost subsidies. No other provision in the tax code produces this kind of marginal rate.
This is why an ACA premium calculator alone isn't enough for 2026. You need a tool that models income scenarios against the cliff — not just estimates a premium at a fixed income level.
How SubsidyGuard's Calculator Differs
Standard ACA calculators take your income and output a premium estimate. SubsidyGuard takes a different approach:
- Cliff distance indicator — See exactly how far your income sits from the 400% FPL cutoff
- Scenario modeling — Adjust Roth conversion amounts, capital gains, and deductions to find your optimal income target
- Side-by-side comparison — Compare multiple income scenarios to see the subsidy impact of each financial decision (paid feature, $29/tax year)
- MAGI-specific inputs — Breaks income into components that actually affect Modified Adjusted Gross Income, rather than asking for a single income number
The free calculator gives you your cliff distance and subsidy estimate. The paid tier ($29 one-time per tax year) unlocks saving and comparing multiple scenarios — useful for early retirees planning Roth conversion ladders or managing variable investment income across tax years.
Frequently Asked Questions
Did ACA subsidies go away in 2026?
Subsidies still exist for households earning between 100% and 400% FPL — only the enhanced credits from the Inflation Reduction Act expired on January 1, 2026. The original ACA subsidy structure, including the hard cutoff at 400% FPL, is back in effect. Previously, the enhanced credits had eliminated the cliff and extended premium assistance above 400% FPL, making coverage more affordable for middle-income households through 2025.
How much does ACA insurance cost without subsidies in 2026?
Unsubsidized benchmark Silver plan premiums vary by age and location. A 40-year-old pays roughly $500–$700/month in most markets. A 60-year-old pays $1,200–$1,800/month. Bronze plans cost less but carry higher deductibles. CNBC reports that the average premium increase for those losing enhanced credits is approximately $1,016 per year — though cliff-affected households face far steeper increases.
Does a Roth conversion count as income for ACA subsidies?
Yes. Roth conversion amounts are included in Modified Adjusted Gross Income (MAGI), which is the income measure ACA uses for subsidy eligibility. A $50,000 Roth conversion adds $50,000 to your MAGI. This makes conversion planning inseparable from ACA subsidy planning — and is exactly the kind of scenario SubsidyGuard was built to model.
What's the difference between an ACA premium calculator and a subsidy cliff calculator?
A standard ACA premium calculator estimates your monthly premium at a given income. A subsidy cliff calculator shows you the income boundary where you lose all subsidies and helps you model different income scenarios to stay below it. In 2026, with the cliff restored, the boundary matters more than the estimate. SubsidyGuard combines both — premium estimation plus cliff-aware scenario planning.